ESPRIT unites four analytical methods under a single user interface. These include EDS for SEM and (S)TEM, WDS, Micro-XRF for SEM and EBSD. This makes it easy for the user to switch between methods with a single mouse click. Additionally, it facilitates combining different method results from the same sample area and to so gain much more information. To name only the most important, coupling of following methods is supported:
- EDS and EBSD
- EDS and WDS
- EDS and Micro-XRF for SEM
The software is designed to suit the needs of all levels of users - from beginner to expert. Novices will benefit from the assistants that help performing routine tasks without having to learn details of the measurement method. More experienced users will value the option to drill down deeper, when they need it, meaning both detailed setup of measurements as well as in-depth analysis of results and automation of tasks.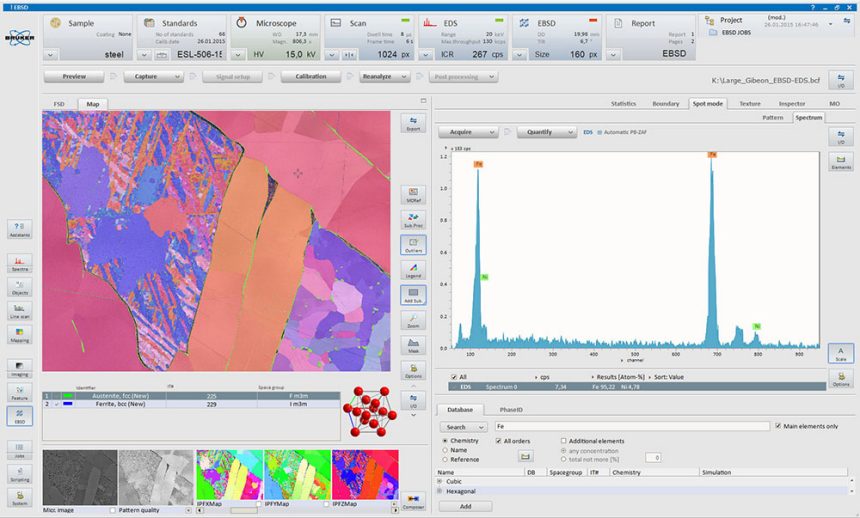
Spectrometry Functions
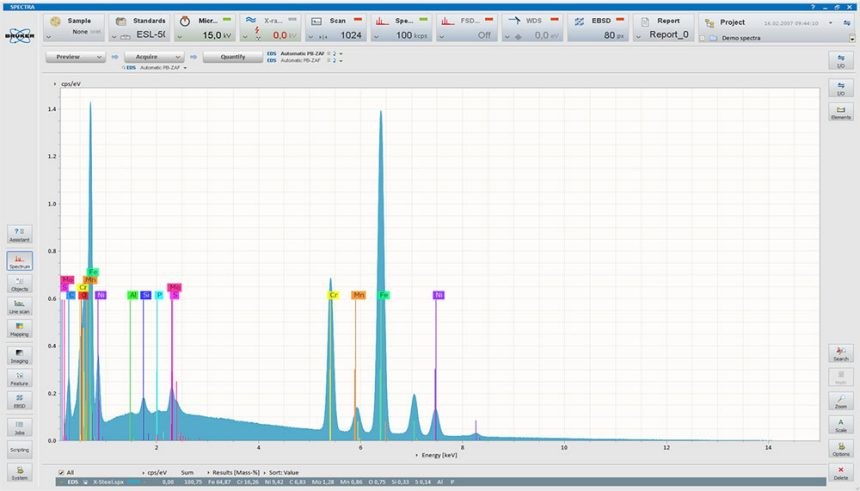
ESPRIT Spectrum

ESPRIT Spectrum is the basic software package of all QUANTAX systems that allows spectra acquisition from all available sources (EDS, WDS and Micro-XRF for SEM) and qualitative analysis. It comes with numerous options for fast and efficient spectrometry.
- Spectra acquisition from all installed sources (EDS, WDS, Micro-XRF for SEM) with accurate, hardware-supported real time, live time, or event counter pre-selection
- Automatic spectra correction for all known detector artifacts (escape, shelf, tail, shift, pile-up, etc.)
- Multiple spectra display with selectable foreground and background spectra
- Spectrum preview and live spectrum display with down to 100 ms refresh time to support real-time spectrometry
- Fast access spectra buffers for acquired data, batch processing and reference spectra
- Scaling and display options including line markers, logarithmic scaling, cps-scaling, and auto-adjustment
- Interactive element identification tools (Finder, X-ray line browser) based on the world's most comprehensive atomic data library, alternatively automatic identification
- Event counter for any number of selected ROIs and support of up to 8 hardware single-channel analyzers
- Measurement parameter manager and spectrum header editor
- Import and export of various common data formats, graphics export via clip board or image files
- Full system control including hardware profile editor, service functions, and fast auto calibration
- Spectrum mathematics (addition, subtraction, linear combinations)
ESPRIT Quant Tools

This package contains a range of tools for standardless and standard-related quantitative spectra evaluation. The proven P/B-ZAF routine is available for genuinely standardless EDS analysis. Standardless P/B-ZAF quantification is based solely on data derived from the spectra themselves, it does not use any predefined peak profiles or similar aids stored on disk. Micro-XRF for SEM uses a standardless Fundamental Parameter method based on the Sherman equation.
Standardless EDS quantification contains the TQuant algorithm for light element and low energy peak quantification. Standard-related analysis of polished bulk samples can be performed using Φ(ρ,z) correction. In cases where appropriate element standards are not available, ESPRIT Quant offers hybrid quantification: The concentrations of these elements are determined standardlessly while the remaining are quantified using standards.
ESPRIT LineScan

The ESPRIT software suite offers both qualitative and quantitative line scan options.
ESPRIT Line
Ultra-fast line scan with spectra data base:
- Line profiling for any number of elements or ROIs (energy ranges)
- Arbitrary selection of scan line position, length, and angle using preview image
- High resolution, high speed scan (>100 000 points/s)
- Multiple scans with data accumulation for reduction of sample stress
- Manual start and stop or preselected acquisition time
- Spectral database containing all sample points, can be stored to disk an reprocessed at any time
- Selection of elements prior, during, or after line scan acquisition
- Filter and display options for result presentation and graphics export.
ESPRIT Qline
Quantitative evaluation of line scan spectra data base:
- Standardless quantitative analysis for all sample points including deconvolution and matrix correction
- Automatic element identification and predefined or interactively optimized evaluation strategies
- Spectral data base for all sample points can be stored to disk and reprocessed at any time
- Versatile result formatting
- Filter and display options for result presentation and graphics export
- ASCII and Excel® format export of line profile data
ESPRIT Mapping Tools

The ESPRIT mapping software offers tools for classical qualitative and quantitative mapping, as well as HyperMap, where a complete spectrum is stored for each mapped point; for example PTS, position-tagged spectrometry, hyperspectral imaging.
All types of maps can be acquired and processed, including stage maps for WDS and Micro-XRF for SEM. A maximum resolution of 4096 x 4096 pixels is supported for single field of view maps and for instruments using image stitching on a computer with 64-bit operating system. An automatic phase analysis tool is available to be used on qualitative, quantitative and hyperspectral maps for improved phase visualization and additional processing.
ESPRIT Imaging
A Variety of Imaging Options – from Simple Image Acquisition to Fully Featured Image Processing
ESPRIT Scan
Image acquisition software supporting instruments with an external scan system:
- External electron beam control, mode switching, and image acquisition for SEM, STEM and EPMA
- Drivers for IO-Scan and SEMLink
- High quality, high resolution digital images from selectable analog signal sources (SE, BSE, HAADF, etc.)
- Fast preview mode for scan area selection and beam adjustment
- Independent selection of acquisition time, image resolution and scan modes
- Pixel, line and frame averaging including power line synchronization (option)
- Automatic and manual brightness, contrast and gamma correction
- Display of histogram
- µ-marker and image legend display including configuration options
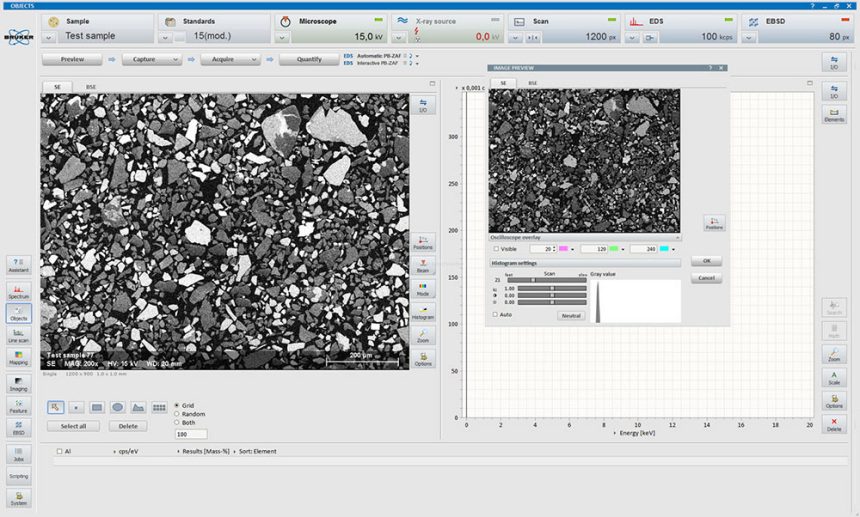
ESPRIT ColorScan
Acquisition of X-ray enhanced color images:
- Instant color images without element preselection or presetting of X-ray ranges
- Intuitive discrimination of phases by different colors and shades in high resolution electron images
- Impressive combination of topological and chemical contrast
- Easy searching for points and regions of interest
- Highlighting of particles, artifacts, or unique regions on sample surface
- Search for homogeneous regions for exact analysis results
- Progressive scan with improving image quality
- Optimally suited for high-speed XFlash® detector systems
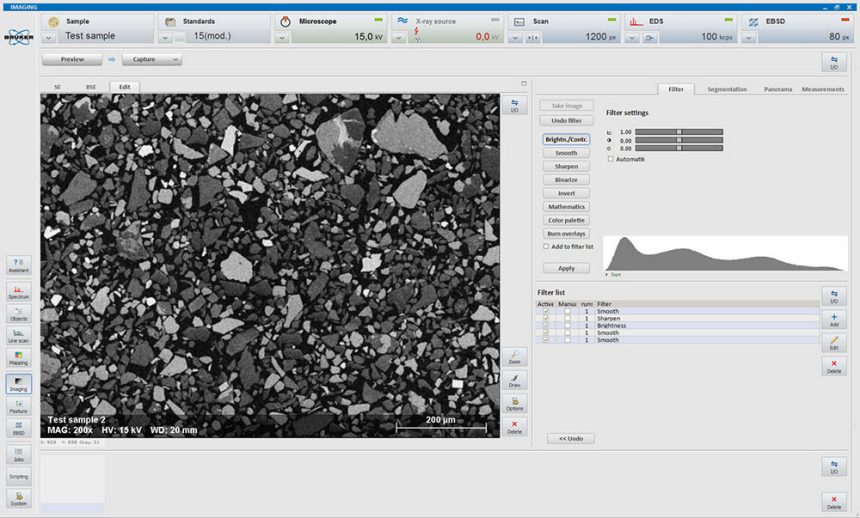
ESPRIT Vision
Digital image processing:
- Choice of configurable image filters including binarization and inversion
- Brightness, contrast and gamma correction
- False color display
- B/W and color image processing
- Overlay image for markers, legends and user defined graphics
- Interactive length, area, and angle measurements with data presentation in graphical overlays
- Multi-stage image processing including internal image storage and multiple “undo” functionality
- Image import and export in all common graphic formats
- Twain export and windows clipboard supported
ESPRIT Stereo Vision
3D image visualization and measurement:
- 3D surface topology reconstruction from an stereoscopic image pair
- Free choice of tilt axis including asymmetric tilt facilitates image acquisition with standard SEMs
- Adaptive image comparison modes (anaglyphs, difference image, and full frame correlation)
- Single point depth calculation, line profiles, and multipoint operation
- Powerful 3D result visualization by wire grids, shading, artificial texture, or displacement vectors
- Fully reprocessable project data bases including original data, results, and settings
ESPRIT DriftCorr
- Compensates the image shift of the scanned specimen area by comparing the current image with the image acquired when starting the measurement
- Automatically corrects the external scan generator during acquisition
- Shows the current and the maximum shift value as well as the quality of the comparison process
- Stops the measurement when the maximum correction value is exceeded
- Works in combination with image acquisition functions and the options MultiPoint, Objects, LineScan, Map and HyperMap
EBSD Functions
Measurement Setup
The ESPRIT EBSD software offers a range of assistants and tools for setting up and performing measurements.
Signal Setup
ESPRIT for EBSD features the Signal Assistant that automatically adjusts acquisition settings like camera exposure time and gain. This results in optimally illuminated pattern images. Readjustment is only necessary if measurement conditions are changed.
The advanced user can also setup all parameters manually using the controls provided, allowing fine tuning of pattern quality according to special requirements.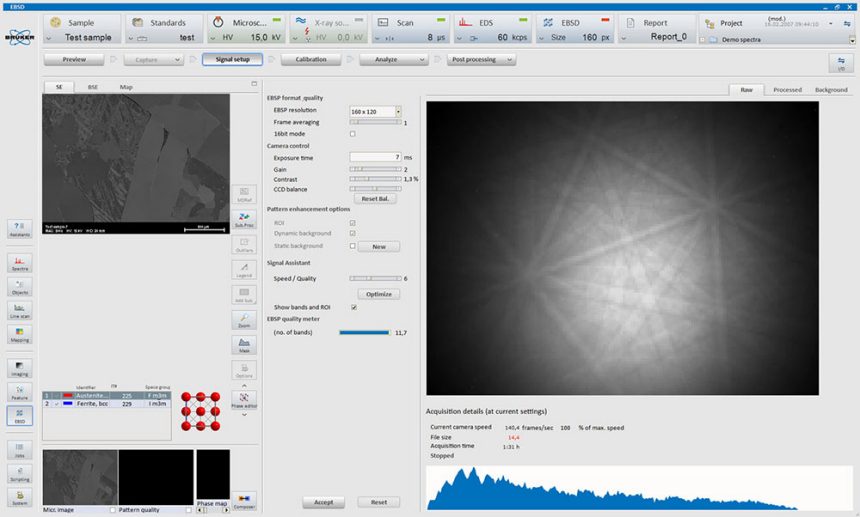
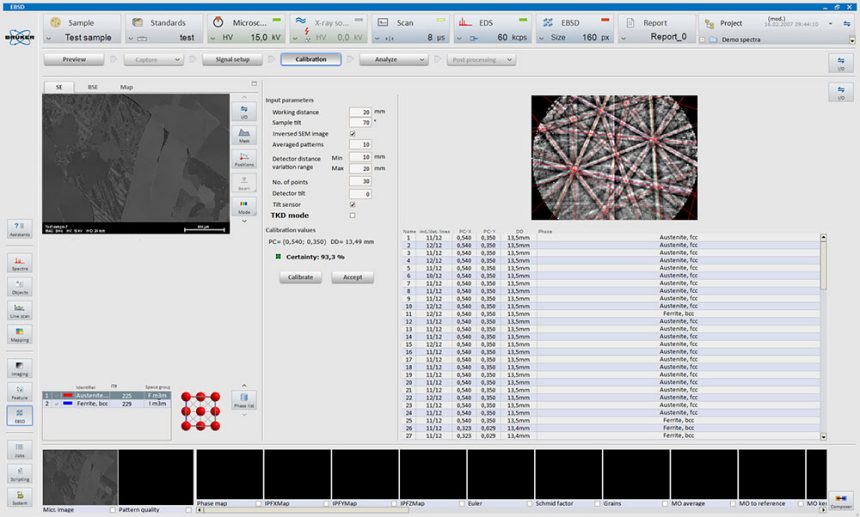
Pattern Center Calibration
Exact pattern center calibration is an absolute necessity for correct indexing and for avoiding misidentification of phases. ESPRIT for EBSD provides a sophisticated Calibration Assistant which automatically performs this task using the current sample (no calibration standard required). Re-calibrating is only necessary after changing the sample-detector geometry, e.g. sample-detector distance or detector tilt.
The expert user can also perform manual pattern center calibration. This feature works in spot mode and allows manual band detection fine tuning, which is then followed by automatic indexing and pattern center coordinates refinement.
Drift Correction
EBSD measurements may be prone to sample drift for several different reasons. ESPRIT contains a powerful drift correction feature that also supports EBSD measurements and compensates image drift.
Acquisition Automation
Stage control can be used for comfortable measurement automation. It can either be used to acquire data from large sample areas at high resolution by stitching fields of view (maps) together. Alternatively, the user can launch multiple measurement jobs at different locations and magnifications on the sample surface.
Autosave Function
Very large datasets containing patterns and EDS spectra can be saved automatically at the end of each measurement. This function is especially useful for unattended data acquisition.
Data Presentation Options - Postprocessing
The analyst often faces the challenge of how to present data in a way that material properties of interest can easily be assessed. The ESPRIT software suite for EBSD offers a large number of data representation tools to fulfill that need.
Subset selection
ESPRIT provides the analyst with the option to create data subsets using different criteria, allowing to focus on specific features. Subset selections can be applied to many of the data and the presentation options described on this page: maps, histograms, pole figure and phase list. Subsets can be processed using multiple operations, among them union, subtraction, intersection and expansion. Masks can also be used.

Pattern quality map
This is an important tool for judging the quality of a measurement. Pattern quality is influenced by acquisition parameters, sample properties; for example phases, boundaries, lattice strain and also by sample preparation. The pattern quality, sharpness of the Kikuchi pattern, at each point of the map is brightness coded to produce a gray scale image. These images are useful as a base for overlaying with other types of maps, as they show microstructural features like grain boundaries.
Phase map
All identified phases are displayed in a color-coded phase distribution map.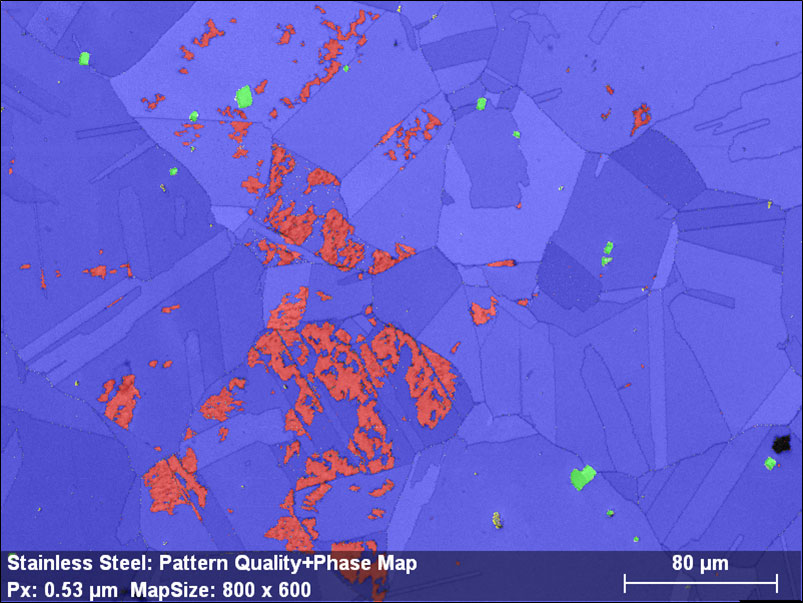
Stainless steel, pattern quality overlaid with phase map: ferrite (red), austenite (blue), titanium nitride (green), titanium sulfide (yellow)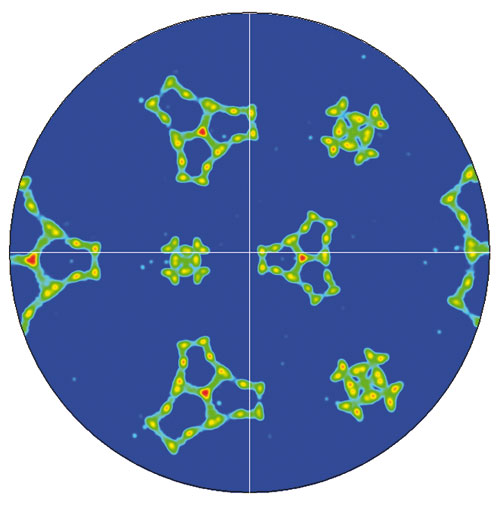
Pole figures
Pole figures are one of the most common representation tools for orientation data. They show the distributions of the selected poles {hkl} considering all orientation measurements. Pole figures provide important information on strength of texture and also on which texture components are dominant. ESPRIT for EBSD generates pole figures and their corresponding diffraction sphere (viewed in 3D) in high resolution and with unprecedented speed.
Inverse pole figures (IPF)
While pole figures display crystal orientations with reference to the stage coordinate system, the IPFs describe a chosen stage system axis as a crystallographic vector. Since there are many symmetry-equivalent vectors, the IPFs are reduced to the symmetry-specific sub-spaces (as shown in the figure on the right).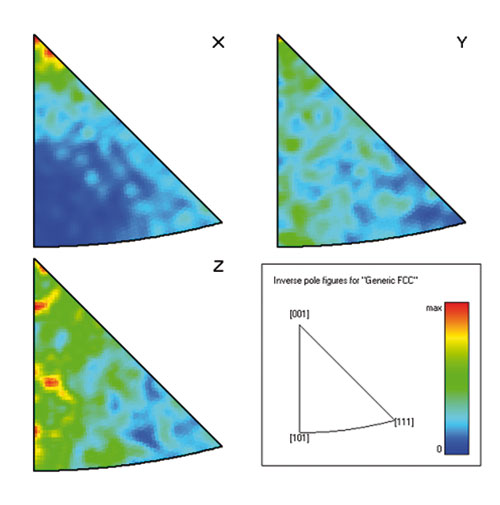
Inverse pole figures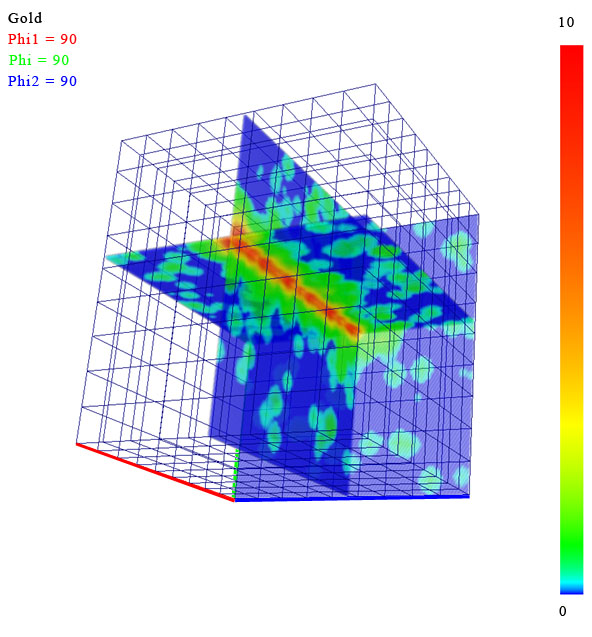
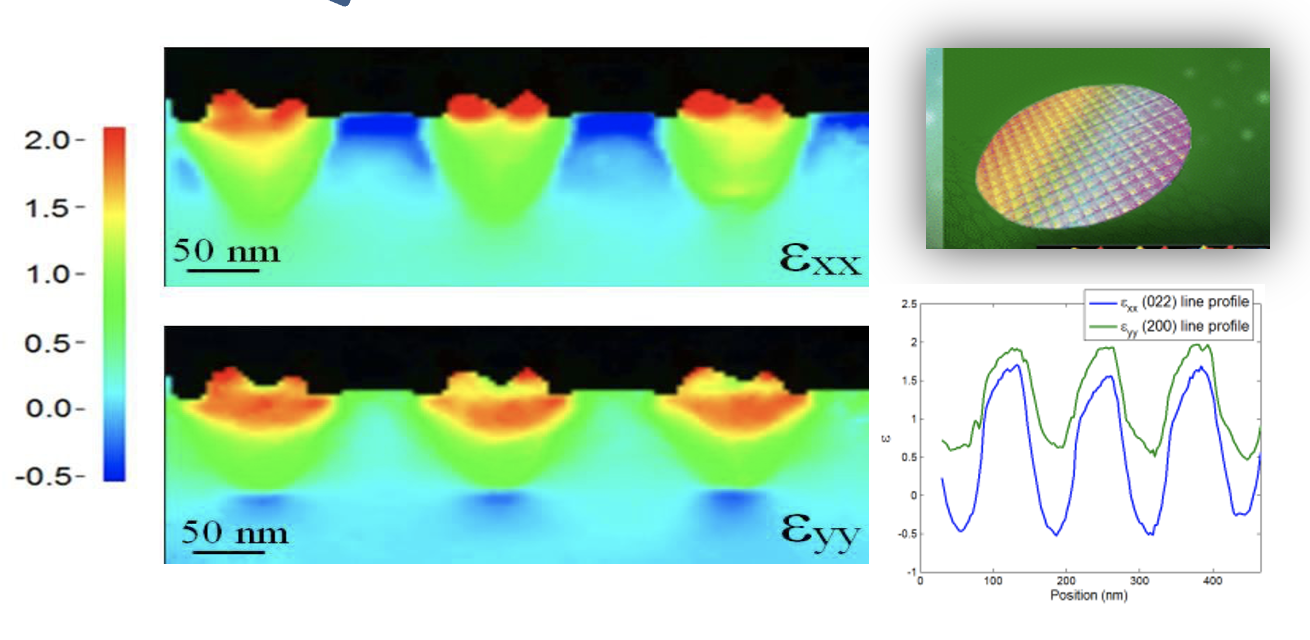
ODF space visualization for a gold film deposited on a silicon wafer
Orientation distribution function
2D cuts and 3D visualization of the ODF space, using modern Open-GL technology for fast and interactive display.
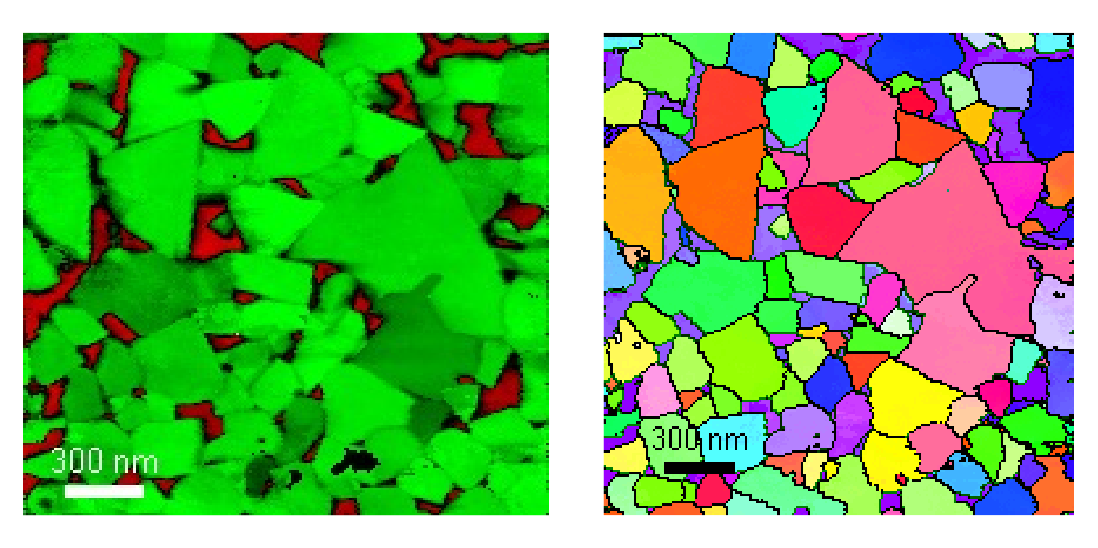
IPF map
An IPF map combines the locally detected orientation with the crystallographic description of a single reference direction. The color coding is scaled to the reduced size of the IPF.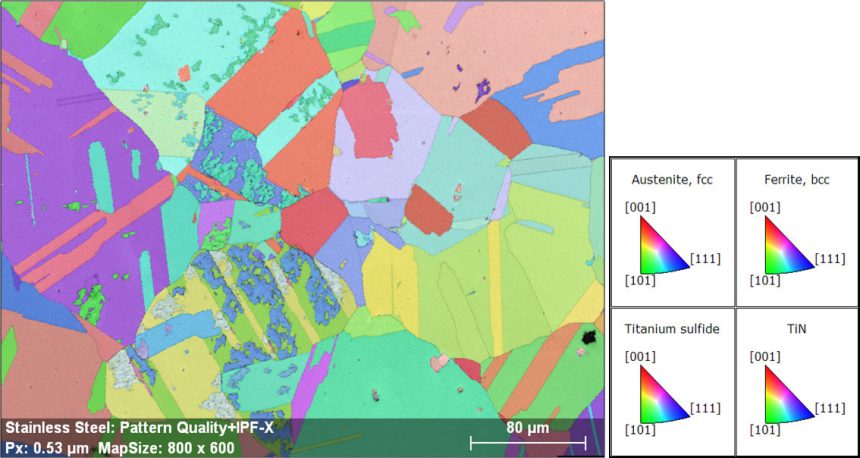
Stainless steel, pattern quality map overlaid with the IPFX map

Grain Average Misorientation maps showing the “accumulation of deformation” inside the ARMCO steel grains at different stages of the in-situ tensile testing experiment; colors show orientation changes from 0 to 7 degrees
Euler map
An Euler map displays the detected orientation at each point on the basis of the Euler angles which are encoded in RGB.
Grain analysis
Supports detection of grains using misorientation and size criteria, ∑3 boundaries can be ignored if desired. Grains can be analyzed with respect to shape, size and main axis inclination (in case of elongated grains). Detected grain maps can be produced with the grains in random colors.
Also included are misorientation distribution analysis features. A misorientation profile along a line as well as a misorientation distribution histogram can be calculated. Misorientation maps can be displayed in form a grain average misorientation map, a kernel average misorientation map and reference misorientation map.
Texture components
ESPRIT for EBSD supports the generation of texture component maps, allowing the definition of texture components and their spread from an "ideal" orientation using a rainbow palette. This feature can also be used for the creation of subsets.
Re-analysis Functions
A Real Strength of ESPRIT for EBSD
The software can store full patterns or band positions. This allows the use of re-analysis functions at an unprecedented speed without necessity of re-running a measurement; for example in case an unexpected phase was missed. Re-analysis may be re-indexing with manual phase selection or Advanced Phase ID for complete sample characterization.
Comprehensive phase databases
ESPRIT contains the Bruker Phase Database as well as the American Mineralogist Phase Database (AMCSD) to enable phase identification. The Inorganic Chemistry Structure Database (ICSD) or the Crystallography Open Database (COD) are both optionally available and can be included in ESPRIT as well.
Phases can be searched by simple and fast input of elemental data using a periodic table display, search is also possible by chemistry, crystal symmetry or phase name. The search can span several databases.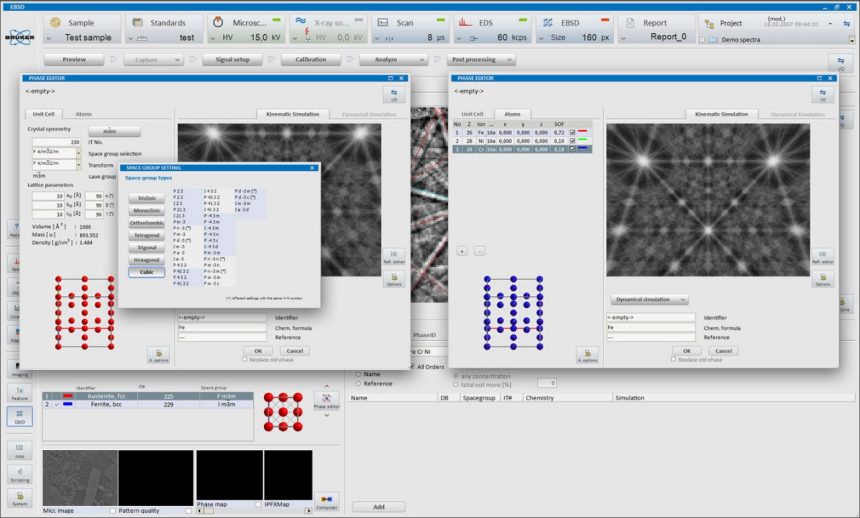
EBSD Phase Editor in ESPRIT
The phase editor
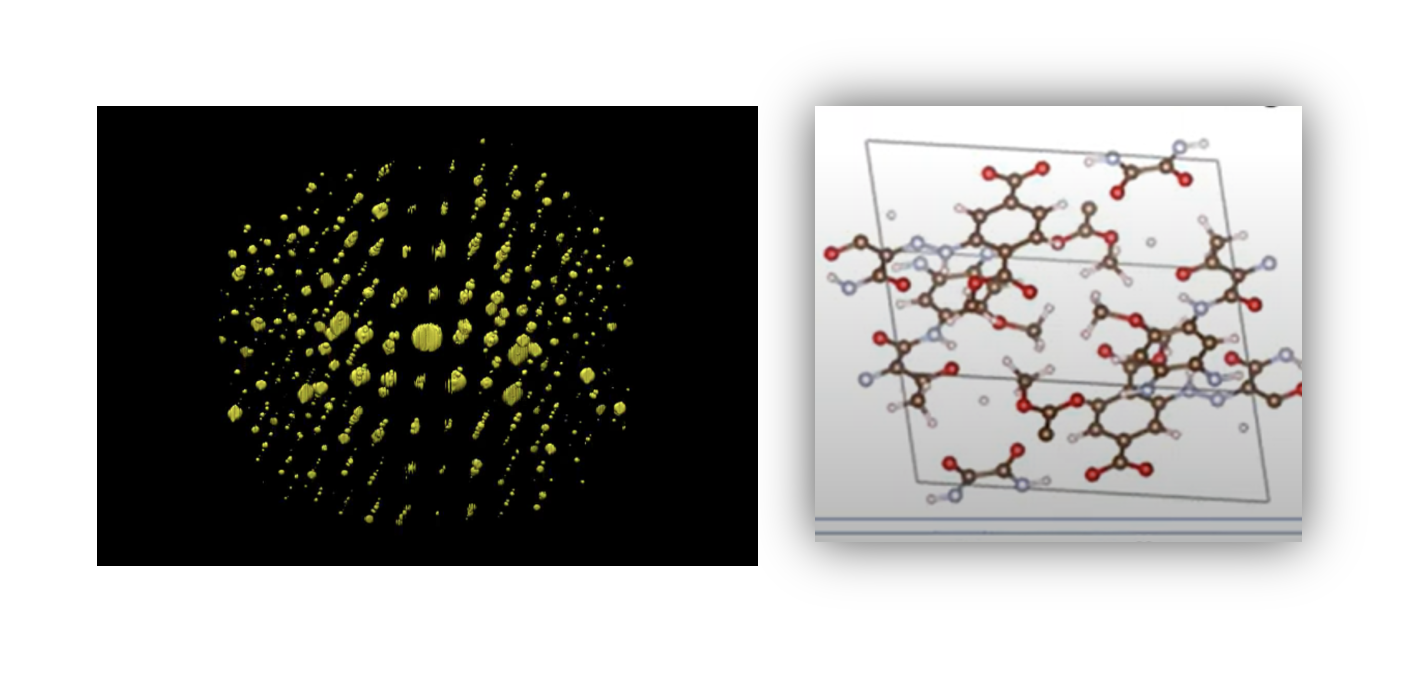
ESPRIT contains a powerful phase editor that provides the user with the means for creating and / or editing crystallographic phases. The phase editor interface can also be used to calculate pattern simulations using the dynamical theory of electron diffraction. It features:
- Easy entry of crystallographic data (asymmetric unit)
- Supports all crystal symmetries
- Generation of atomic positions on the basis of crystallographic space groups
- Support of Laue, point and space groups (recognizes more than 700 different space groups)
- User-friendly selection of the 230 standard space groups (Herman-Mauguin)
- 3D animation of crystal structure and unit cell: atoms can be faded in/out for better visualization of substructures
- Fast pattern simulation based on dynamical theory of diffraction (option)
- Intensity calculation of reflectors based on kinematic theory
- Real time animation of kinematic intensities as bands in 256 grey levels as gnomonic, stereographic and spherical projections
- Excitation voltage (wave length) for EBSP simulation can be set arbitrarily
- User defined colors for each reflector family
- Simultaneous rotation of structure and simulation including zoom
- Full screen mode support
- Import of Crystal Information File (CIF), *.cel-files (PowderCell) or *.cry-files (Twist (CHANNEL5™))
Fast Re-indexing with up to 40,000 points/s
The EBSD software is capable of re-indexing datasets in incredibly short time. Single phase materials can be re-indexed with around 40,000 points/s. The advantage of re-indexing is that measurements can be re-analyzed when not all phases have been selected or known initially.
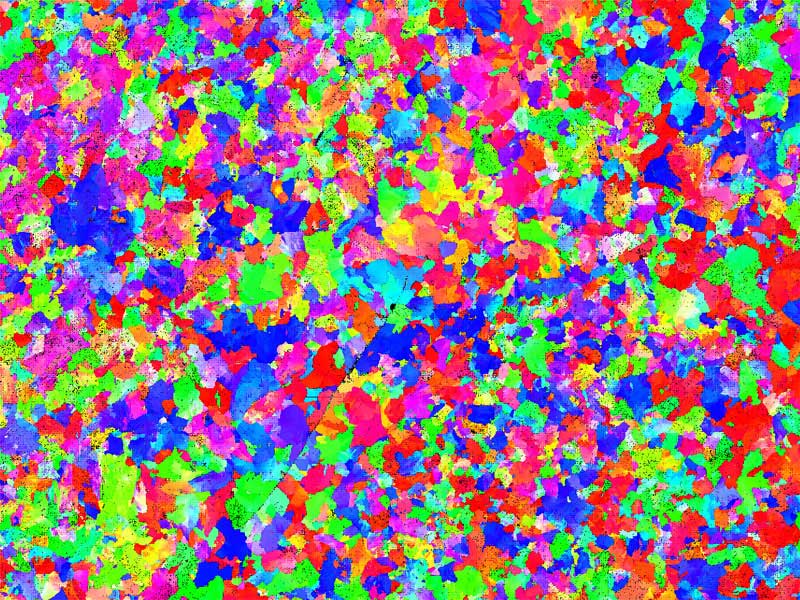
Orientation map of a deformed ferritic steel, original map size 1600x1200 (1,920,000) patterns, pixel size: 0.610 µm, re-indexed in 36 s, 54,000 points/s, 1.6 % zero solutions
Advanced Phase ID
The Advanced Phase ID feature builds on the continuous development work at Bruker for integrating the EBSD and EDS techniques. Combining ESPRIT for EBSD’s ultrafast indexing algorithm with a robust and rapid phase search engine as well as interactive band detection, the Advanced Phase ID feature determines the best phase file fitting the crystallographic phase under investigation.
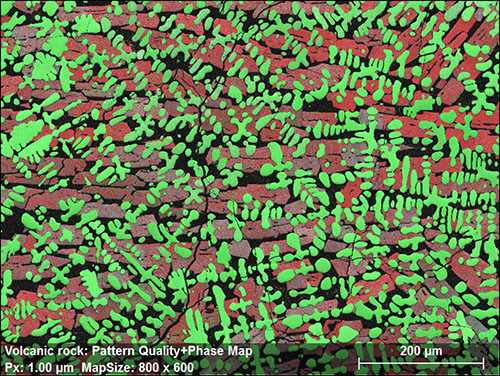
Volcanic rock containing fayalite and wuestite phases, indexed with manual phase selection
The Advanced Phase ID feature can be used online (at the SEM) as well as offline on a separate computer. ESPRIT for EBSD’s unique data handling, Advanced Phase ID feature and ultrafast offline re-indexing allow launching a measurement with no need for identifying all present phases in a multi-phase material. Missing phases can be identified offline and used for subsequent re-indexing of the EBSD data thus significantly improving the user and SEM efficiency.
-
-
-
-
-
-
-
-
-

-
-
-
-
-
-

-
-

-
-
-
-
-
-
-
-

-

-
-

-

-
-
-

-
-
-
-
-
-
-
-
-
-
-
-
-
-
-
-
-
-
-
-
-
-
-
-
-
-
-
-
-
-
-
-
-
-
-
-
-
-
-
-
-
-
-

-
-
-
-
-
-
-
-
-
-
-

-
-
-

-
-

-
-
-

-
-

-
-
-
-
-
-
-
-
-

-
-
-
-